
Clutch or Luck? Brian Kelly’s Performance the Past Five Seasons

The Pythagorean expectation—brought into the sports vernacular by baseball statistician Bill James—in its most simplest form is a tool used to describe how “lucky” a baseball team was in a given season. By comparing runs scored versus runs allowed, James was able to derive a relationship between winning and scoring margin, and thus could show a team to be performing above or below expectation. For example, if a team scored 300 runs and allowed 300 runs over the course of a season, its “expected” winning percentage should be .500 (81 wins versus 81 losses) to correspond with the zero scoring margin. If that team’s record is actually 85 wins and 77 losses (a win percentage of .525), then it’s generally assumed that the difference between the actual win percentage and the expected win percentage is the result of luck. In a nutshell, future expectations should be more in line with the team’s expected winning percentage, rather than the actual percentage.
James’ formula does not hold up well for college football, but the principle of there being a close relationship between a team’s overall winning percentage and its season-long scoring margin does. In this sample of five seasons (2005-2009), the average scoring margin is highly predictive of a team’s winning percentage. In fact, it explains nearly 93% of the variation in winning percentage, as shown below.
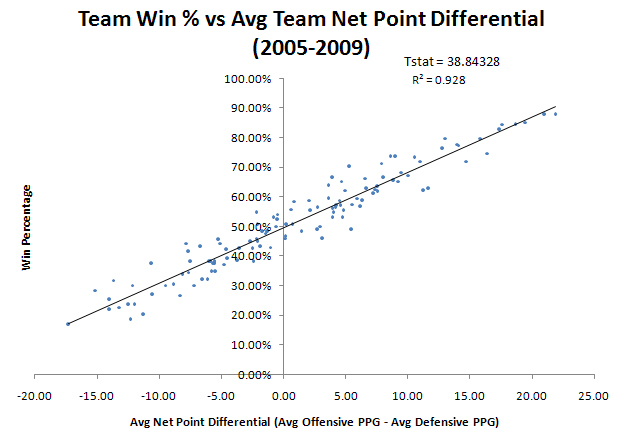 The question is: what is that 7% of variation that is not explained by point margin? Have some teams just been either lucky or unlucky during the best five seasons? This would make some sense in baseball, but football is a game where team’s have a little bit more control over the outcome of each play. Think about the 2009 Notre Dame season. How many of those close losses can be pinned on luck rather than a defense that couldn’t stop anyone at the end of games? My theory is that the variation is the result of the ability or inability of some coaches being able to get their teams to perform in clutch situations.
An Example
Take the 2009 Cincinnati – Pittsburgh game. Brian Kelly has either been the third luckiest coach over the past five seasons (stemming back to his time at Central Michigan), or the third best at closing out games in his team’s favor when all else seems to be equal. Dave Wannstedt has either been the seventh unluckiest coach over the same time period, or the seventh worst at closing teams out.
Let’s move forward to 3:08 minutes left to go in the game—both teams are tied at 38 and Pitt has the ball on Cincinnati’s 32 yard line.
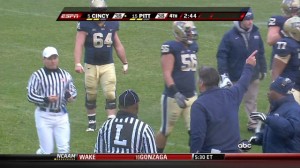
3:08, Pitt 1st and 10 at Cincinnati 32 yard line
Cincinnati DE Matthews has a slight grab on Pitt RB Deion Lewis’ facemask as he tackles him—no call by the referees. Wannstedt is incensed, jumping up and down and pointing at the Heinz field jumbotron. The clock keeps moving, so Pitt has to run another play.
2:44, Pitt 2nd and 12 at Cincinnati 34 yard line
Pitt runs again and Cincinnati calls timeout to preserve time. Wannstedt spends the timeout in the official’s huddle complaining about a non-call that he can’t get back, rather than in his team’s huddle.
On the next play, Pitt converts a nice third down pass to Jonathan Baldwin so it all seems like a moot point. Lewis runs into the endzone with 1:37 left to go two plays later.
1:37, Pitt extra point attempt
The Pitt holder loses control of the ball and the extra point is botched, so the score is Pitt 44 – Cincinnati 38.
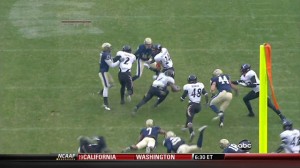
Cincinnati kick return
Cincy return man Mardy Gilyard slips on the turf, or else he’s gone for a touchdown.
Pitt plays the ensuing series with a three man rush, deep prevent defense. The Cincy receivers run routes to clear up the middle for a single receiver who is running open every time because the Pitt D is so focused on preventing the homerun ball.
With 39 seconds left, Cincinnati is already at the Pitt 29 and calls timeout.
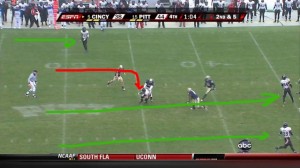
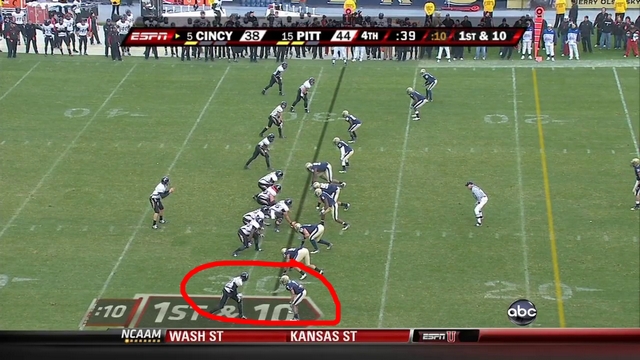
00:39, Cincinnati 1st and 10 at Pitt 29 yard line
Pitt comes out of the timeout and shows a five-man pass rush against Cincinnati, who is lined up with five receivers. This is an extremely aggressive call given the situation and forces Pitt into man-coverage with a single safety playing the middle of the field. The single receiver at the bottom of the formation is Armon Binns, who is being projected to go higher in next year’s NFL draft than his teammate Gilyard, so this seems like a pretty easy tactical decision for Cincinnati.
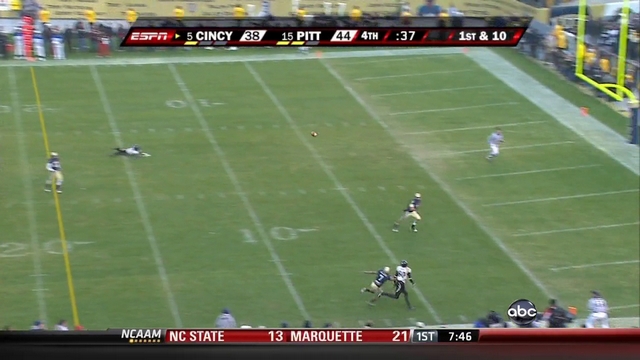
 Pike throws a perfect pass as Pitt’s corner falls over while Binns blows past him for an easy touchdown. Cincinnati converts their extra point and wins 45 to 44.
 Now, how much of a factor did luck play in this? Sure, Cincinnati lucked out that Pitt muffed their extra point. But then, Pitt lucked out when Gilyard tripped over himself on the ensuing return on what would have been a touchdown. Instead, it seems to me that you can look at Wannstedt’s temper tantrum to the officials over a play they couldn’t call back for clues about his team crumbling at the end. He was irrationally overreacting to a play that he couldn’t change rather than focusing on the present. Just as his overly-aggressive five-man rush against Cincy’s 5-WR formation on the last play was an overreaction to Cincy’s success during the previous plays. Both Wannstedt and his team lost their composure and all Cincinnati and Kelly had to do was react—however Cincinnati deserves credit for keeping their composure and recognizing opportunities and exploiting them.
An Analysis
Over the course of the last five seasons, Kelly’s teams have outperformed their expected winning percentage by an average of almost eight percent. What this means is that, on average, a Kelly-coached team has won at least one more game per season than it was expected to. One could say that he’s been lucky—and yes, some randomness plays a factor—but I think it speaks more to his ability to get his teams to perform in clutch situations. That’s not to say that anyone should expect Kelly to win every close game at Notre Dame, but rather they should feel more secure in knowing that he has a better history of doing so than almost any other NCAA football coach in the last five seasons.
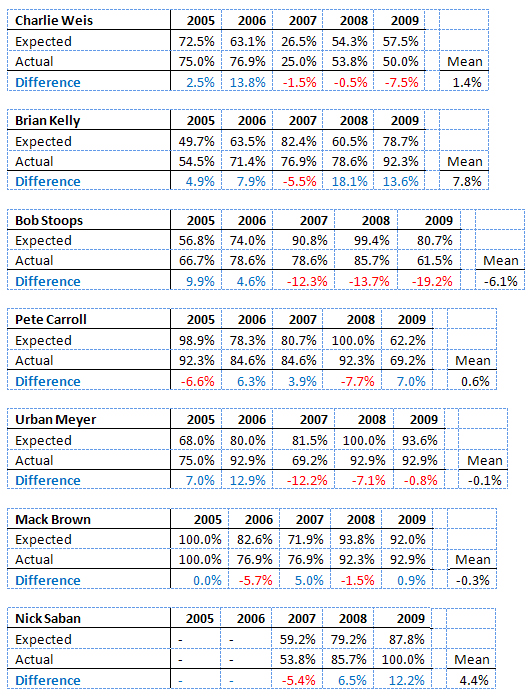
The following two lists consist of coaches who were Division 1 head coaches from 2005-2009. A brief note regarding two coaches omitted from the chart below due to tenure length: Nick Saban in his three years at Alabama has a positive differential of 4.4%, while Northwestern’s Pat Fitzgerald has an impressive mark of 8.2% through four years.


Here are some individual coaches on a year-by-year basis:
Some Critiques and Responses
Critique
Omahadomer pointed out in the original thread on NDNation that this metric would make Tyrone Willingham the most “clutch” coach at ND and believes it tracks luck more than anything else.
Response
This analysis is a fairly good model of the time frame (2005-2009) and I’m tentative to insert data points from previous years. Tyrone Willingham’s performance at Washington seems to fit well with the perceived expectations (something like -4.2% per year on average). With that said, this metric will not fully explain the picture and is merely a tool. Like any effective analysis, you need to look at it from both a quantitative and qualitative viewpoint.
Critique
Some of the coaches who play in weak conferences might look better when they suffer blowout losses to bigger BCS opponents and subsequently play a fairly normal schedule in their conference.
Response
There’s probably some truth to this, although coaches like Patterson at TCU and Petersen at Boise State are pretty close to expected.
Critique
Why do some coaches have an expected winning percentage of 100%? Coaches seemed to be penalized for having a high expected winning percentage.
Response
I think Meyer and Carroll both had actual expected percentages in 2008 that went over 100% using the formula above and I just capped them at 100%. It was a bit of a reach to plug yearly data into a formula based on five year averages and I did it because the alternative was a lot more time consuming. The formula basically says that if your scoring margin averages +27 points a game or more you should be expected to win all of your games. On the flip side, if you average -27 points a game you should be expected to lose all of your games. If you look at USC and Florida’s 2008 seasons, their losses to Oregon State and Mississippi, respectively, can be considered largely unexpected upsets, especially in retrospect.
As far as being penalized for having a high expected winning percentage, I wouldn’t say that’s necessarily the case. I noticed that a lot of the coaches who’ve been in contention for the national title as of late generally perform extremely close to their expected performance based on the formula. It might have more to do with the fact that Urban Meyer, Mack Brown, Pete Carroll, etcetera spend a lot of their time blowing people out and less time playing close games. They might play one or two close games a year, win some and lose some, and it evens out over five years. Guys like Kelly at an upstart like Cincinnati will spend a lot more time playing close games (in my mind) and so there’s a lot more opportunity for swings one way or the other.
So, I wouldn’t say that Mark Richt is a better coach than Urban Meyer or even that he’s more clutch than Urban Meyer. Meyer has built Florida up to the point where he’s closing most teams out in the first half and so the point differential holds up well, where Richt and Georgia play a lot more close games. That’s a credit to Meyer’s program building. All the metric is saying is that they’ve lost some close games and that there may be a bit of an overall trend.
Note: This is only a starting point and a fun theoretical exercise. There are probably better statistical methods for analyzing this. I used the average scoring margin for two reasons:
- In past sets of data that I’ve worked with, the data tends to turn into a cloud. Using five years of data points rather than just combining them into a single average data point would probably show a lot more noise.
- For simplicity, it was a lot easier and less time consuming to just use the average and work with those numbers.
At the End of the Day…
There is luck in the game of football. There are lucky plays and coaches definitely have lucky seasons. The eternal question is what can you do to create your own luck? Can you practice good habits, stay disciplined and focused, be in better condition than your opponent, and stay positive in the face of adversity? Is that really luck? I think it’s something more. It’s a state of mind. It’s one team being consistently tougher than it’s opponent. It’s one coach having his team prepared to be physically and mentally ready to perform under pressure. Toughness isn’t a word anyone would use to describe a Notre Dame football teams fielded in the Weis era, whose one lucky season (2006) is more of a credit to Brady Quinn (in addition to an amazing Jeff Samardzija play) than it is to Weis. Brian Kelly’s 2008 Cincinnati team went through five quarterbacks and still made it to a BCS game playing a schedule that wasn’t a whole lot weaker than Notre Dame’s (Sagarin schedule ratings: ND – 50; Cincinnati – 60).
One thing we can expect from Brian Kelly that we didn’t see from Charlie Weis, despite the latter’s bravado, is some toughness. I think this statistic helps bring some of that difference to light: the outlier in Kelly’s resume is the one season with a negative “clutch” rating. The outlier in the Weis resume is the one season with an overall positive rating. Positives in general have been outliers in South Bend for a while now. But there are some signs, beyond players puking during stretching, that we’ll see more Fighting and less Limp-wristed Irish football in the Kelly era.