2009 Season Prediction Survey Results

Now that the voting is over, it’s time to present the results.
First, thanks to all who participated. At the time of this analysis better than 200 people cast votes. For each game on Notre Dame’s 2009 schedule voters were asked to select their confidence in a win. Predicting the outcome of the 2009 season via the win confidence of each game is much more accurate than other methods.
Assessing the season on a game-by-game basis also illustrates just how difficult it is to go undefeated in a 12-game season. Even if the Irish had a 90 percent chance of winning every game, they would still only have a 28 percent chance of going undefeated in the regular season. An 80 percent chance of winning each game (close to the mean shown in the table below) translates into only a 6.7 percent chance of going undefeated.
Obviously these aren’t an exact 2009 season predictor, but they do give an idea of expectations.
Simply Speaking
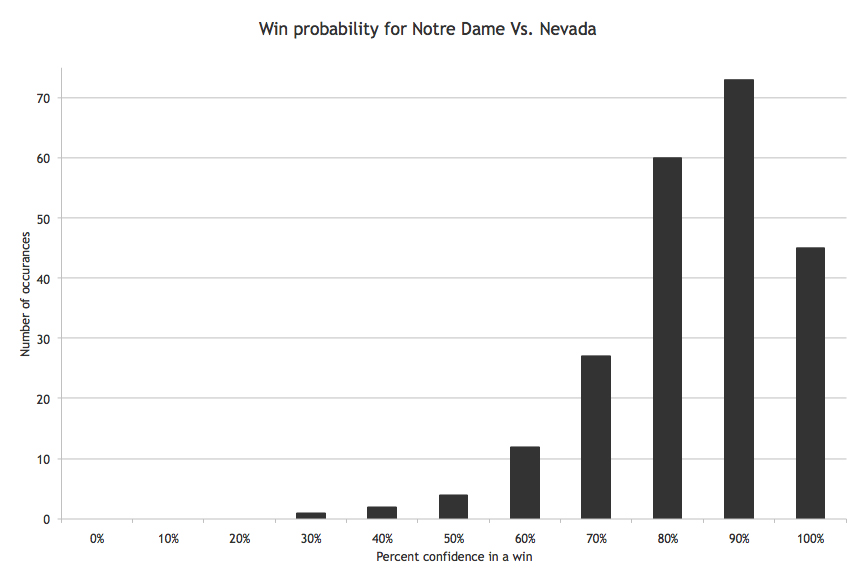
A typical game win probability histogram is shown below. Nevada has been used as an example, but the other games follow similar trends.
As the histogram shows, the overwhelming majority of those polled believe the Irish have better than an 80 percent chance of beating Nevada. The histogram also shows that the voting is approximately normally distributed. This translates to a mean win probability (83.9 percent) and associated standard deviation (13.2 percent).
The table below shows the mean win probabilities for each game on the 2009 Irish schedule per the votes cast here. The standard deviations for each win probability are also noted. A larger standard deviation means more scatter in the data, i.e more disagreement among the voters about Notre Dame’s chances of winning the game. Lower standard deviations are indicative of a more consistent opinion regarding the outcome of the contest.
[table id=229 /]
The average win probability for all the games is 76.1 percent, i.e. on average voters felt the Irish had slightly better than a 76 percent chance of beating each opponent (USC is an outlying data point but doesn’t significantly alter this value).
The simple way to translate the individual win probabilities to a season win total is to sum the values. This equates to a shade over nine (9.1) wins for the Irish. Based on the large amount of returning talent and expected mediocre schedule, this seems like a rather low expectation.
Multiplying the probabilities for each game gives the probability of an undefeated season. Based on the mean win probabilities, Notre Dame has just under a three (2.8) percent chance of running the table.
The table also indicates which contests are sure wins, which games could go either way, and which are stiffer challenges. On average, voters predicted greater than a 90 percent chance the Irish would beat Washington, Washington State and Navy, and better than 80 percent confidence that Notre Dame would win against Nevada, Purdue and Connecticut.
Moreover, there is relatively little standard deviation in the win probabilities for these teams. These six opponents have the lowest variation in average win probabilities indicating high agreement among the voters. In other words, if Irish fans are well-informed, Notre Dame should certainly beat these six opponents.
Michigan, Michigan State, Boston College, Pittsburgh and Stanford all fall between 60 and 80 percent average win probabilities. These are games where the Irish are believed to hold an edge, albeit not a significant one. USC was the only opponent voters felt the Irish had less than even odds (39.4 percent) of beating. But the game against the Trojans is also the one with the most disagreement among pollsters (standard deviation of 18.9 percent).
In summary, the mean win probabilities predict three certain wins over Washington, Washington State and Navy, highly probable wins against Nevada, Purdue and Connecticut, toss-up games against Michigan, Michigan State, Boston College, Pittsburgh and Stanford, and a fairly probable loss to the Trojans.
What Would Ulam, Fermi, von Neumann and Metropolis Say?
The table above indicates Notre Dame’s probability of winning each game. As stated before, summing these probabilities leads to a season win total. But what about the variation in that win total?
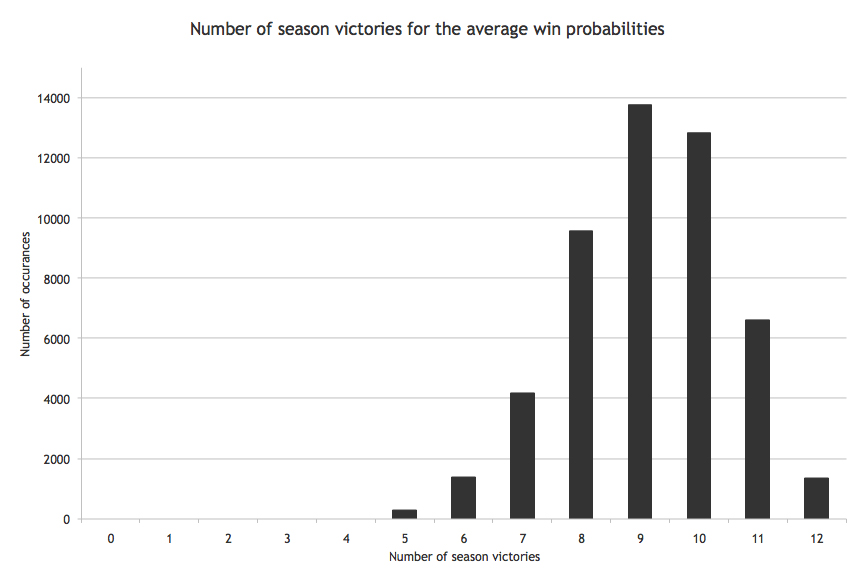
This is where Monte Carlo simulations come in handy. Using several random data sampling iterations a season win total can be predicted via the mean win probabilities. Since the win total varies with each iteration, a distribution of season wins is easily achieved. This histogram below shows this distribution using the average win probabilities.
As expected, the Monte Carlo simulation yields an average season win total of about nine wins. Additionally, it shows that ten wins is almost as likely with eight and 11 wins also being strong possibilities. In fact, the Monte Carlo simulation predicts better than an 85 percent chance that the Irish will win between eight and 11 games and less than a 12 percent chance the Irish will win fewer than eight games.
What About The Optimistic And Pessimistic Views?
After back-to-back disappointing seasons with little readily indentifiable improvement, many voters are likely conservative with their 2009 predictions. This begs the question, what do the optimistic and pessimistic voters think?
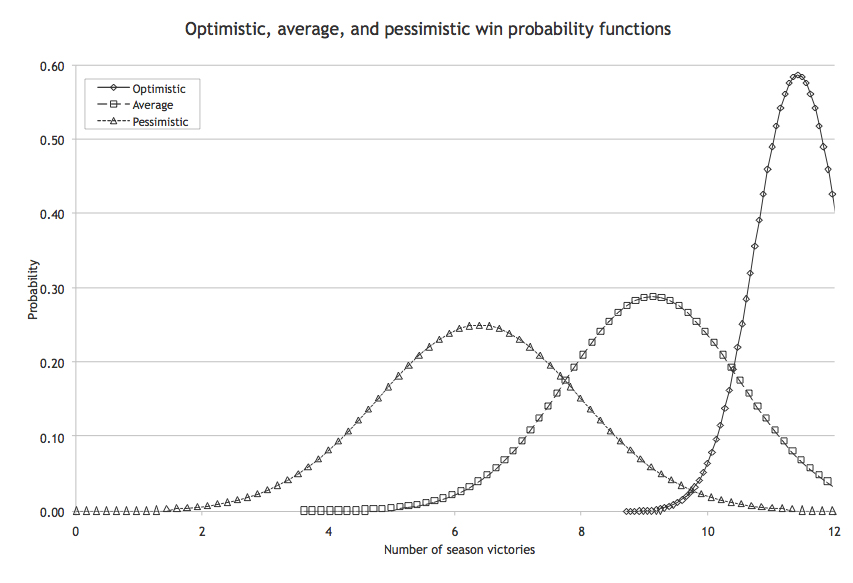
The data detailed above is based on the average win probabilities. The outlying data, however, can be thought of as the optimistic and pessimistic season predictions. In other words, using five (mean plus 1.64 standard deviations) and 95 (mean minus 1.64 standard deviations) percent confidence intervals bounds the predictions.
The plot below shows the season win probabilities for the optimistic, average and pessimistic voter predictions (assuming a normal distributionThe optimistic voters predict an average of nearly 11.5 wins, while the pessimistic voters predict an average of 6.4 wins.
Where Did The Pollsters Get It Wrong?
If there was any year to beat USC, this is the year. The Trojans lost a host of starters from last year’s phenomenal defense, have a first-time starting quarterback and haven’t shown the type of playmaking ability at the skill positions since Reggie Bush departed for the NFL. Moreover, the game is played near the middle of the season, presumably before the Trojans can work out the kinks of a green quarterback and defense full of new personnel.
For Notre Dame, the game is at home, the offense returns virtually everyone, the defense is as athletic as it has been in quite some time, it is a revenge game for the thrashing USC administered last year, and will—in all likelihood—be a statement game for the Irish. Head coach Charlie Weis’ job could be on the line with this contest, and it is fairly certain he’ll pour everything he can into it.
This translates into at least a 50/50 (as opposed to 40 percent) shot for the Irish. Against Pete Carroll, this is about as good as it gets. Carroll is nearly unblemished in non-conference play and is especially lethal coming off a bye week, neither of which bode well for Weis and company.


