A Theory on College Football Performance: Part 1 – The Players
I originally came up with the idea of creating “five-year profiles” because I wanted to evaluate the entire Charlie Weis period at Notre Dame on a scale relative to the rest of college football. The thought was that if we could create a snapshot of what the last five seasons (2005-2009) looked like at ND in comparison to what that same period looked like for other programs, then we could identify what areas of impact the team needs and/or should expect from Brian Kelly and his staff.
This project evolved into something else in the process: a way to determine the relationship between a team’s performance and the normally hard-to-quantify college football variables (i.e. player development). So while the main objective still stands—to evaluate the Weis era and provide an outlook on ND football—we will also explore the general usefulness of this model when looking at college football from a macro perspective further down the road. There are six main variables that are plugged in: I’ll evaluate two per article.
How It Works
Each team is ranked separately according to six key variables (listed below). For the most part, the lower the ranking the better—the only exception being ease of schedule, where a lower ranking simply implies an easier schedule. For example, a team ranked #1 in recruiting means that, in theory, they were the most talented team throughout the 2005-2009 time period. The rankings correlate with a team’s overall win percentage during the 2005-2009 time period, and they basically state “this is why each team had the winning percentage that they did during this time frame.” I think it will make this concept easier to digest if I only introduce two variables at a time.

The more complicated version: Team Win % = bo + b1R + b2D + b3S + b4H + b5CL + b6G + ε
- R — Recruiting Ranking
- D — Player Development Ranking
- S — Ease of Schedule Ranking
- H — Home Field Impact Ranking
- CL — Clutch or Luck Factor Ranking
- G — Gameday Factors Ranking
The b‘s are parameters to be estimated, and ε is a random error term.
Recruiting Ranking
Note: This ranking is independent of the actual rankings that are given out by Rivals.
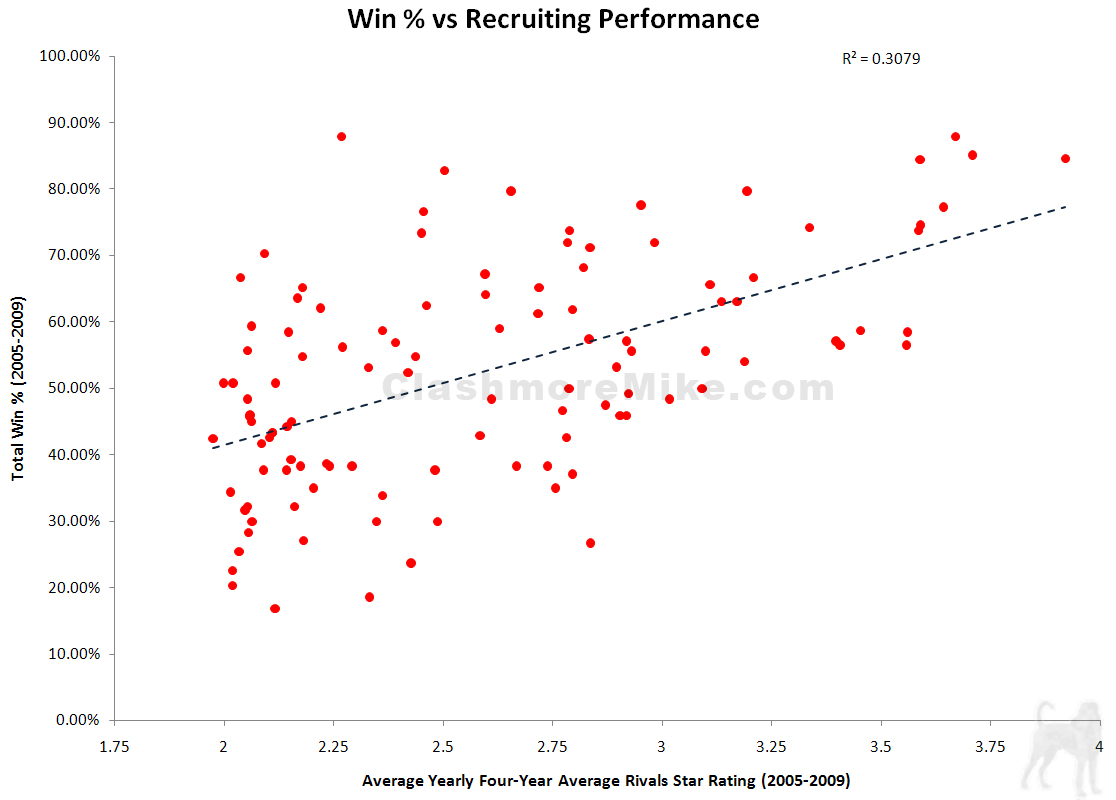
A brief introduction on why I’m using four-year average Rivals star ratings: it’s a statistic more correlated with win percentage than the straight-up Rivals yearly ranking. To determine recruiting ranking, the four-year average is found for each season from 2005 through 2009, and then that result is averaged out. Each team is then ranked by their overall average—the lower the ranking, the better. The recruiting ranking represents the raw talent, independent of any player development or coaching, that a team possessed in the five-year time period. This ranking does not factor in “random” occurrences such as transfers, injuries, academic/disciplinary issues, etc.
There’s a relatively decent correlation between this method of evaluating recruiting performance and a team’s overall win percentage. But most will notice that it doesn’t come close to explaining the full picture; there are plenty of teams at the lower end of the recruiting performance picture with high win percentages. So, while recruiting is obviously important, there are other team factors that must be evaluated. This seems obvious, but the other variables are harder to quantify.
Recruiting Ranking from ND’s Perspective
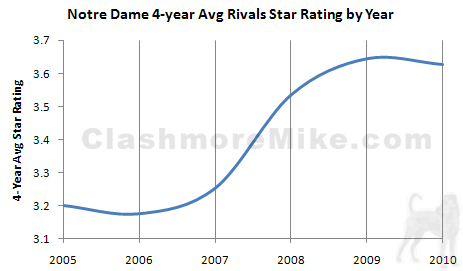
Charlie Weis inherited a strange situation when he took over the Notre Dame head coaching job in 2005 in that Tyrone Willingham’s 2003 recruiting class was pretty good, however Willingham’s subsequent 2004 and 2005 recruiting efforts were, for the most part, absolutely terrible. This left the on-campus talent top heavy, and a drop-off in 2007 was expected—just not to the degree we all observed. Still, as the graph shows, Weis did his best during his tenure as head coach to rope in talent and really raise the bar on recruiting. Weis has left ND’s cupboard stocked, at least on an aggregate level (certain positions are more bare than others—QB for example), and Kelly is stepping into a much better situation, talent-wise, than Weis did.
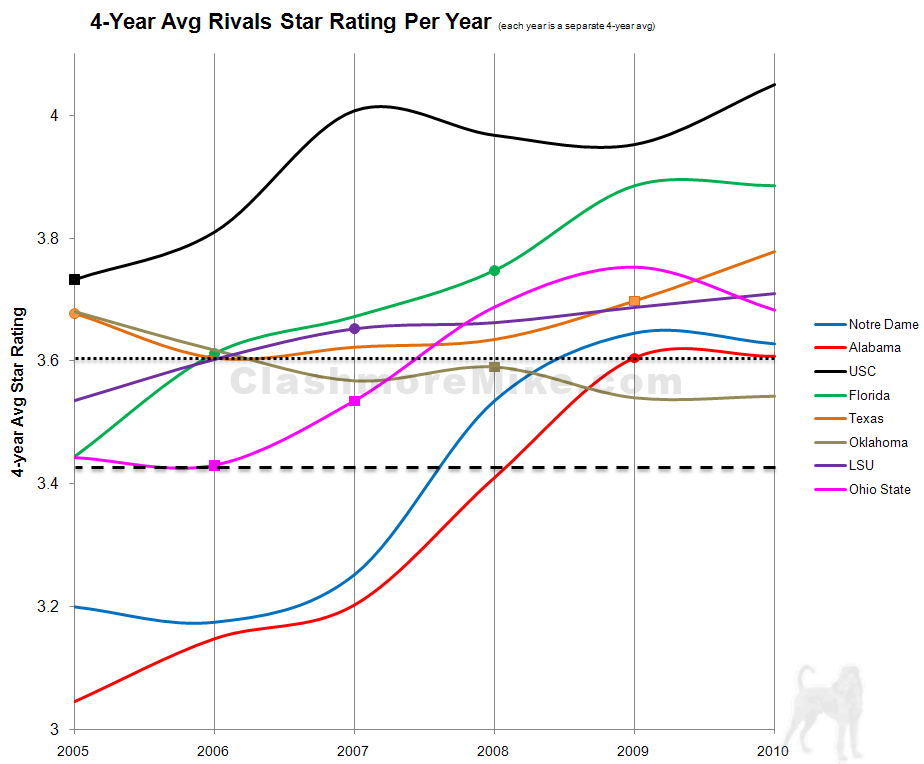
Despite the relative lack of talent in the beginning of the Weis era in relation to where it is today, Notre Dame was still ranked 11th overall during the 2005-2009 period in terms of recruiting ranking. This means that, theoretically, there were only 10 other teams with more raw talent than what the Irish had on campus during the 2005-2009 time frame. As shown on the graph on the right, the 2009 team had more raw talent on it than the eventual national champion, Alabama, and many of the other teams that had played in the national championship in the last five years. Notre Dame underachieved big time, especially in 2009. ND fans know the story all too well: Weis could recruit talent, but he couldn’t develop it. If there’s one thing the fans will want Kelly to maintain from the Weis regime, it’s recruiting. Here are some reasons why:
- No team with a 4-year average Rivals star rating below 3.43 has played in the national championship game (Ohio State, 2006) in the last five years.
- No team with a 4-year average Rivals star rating below 3.61 has won the national championship in the last five years (Alabama, 2009).
Player Development Ranking
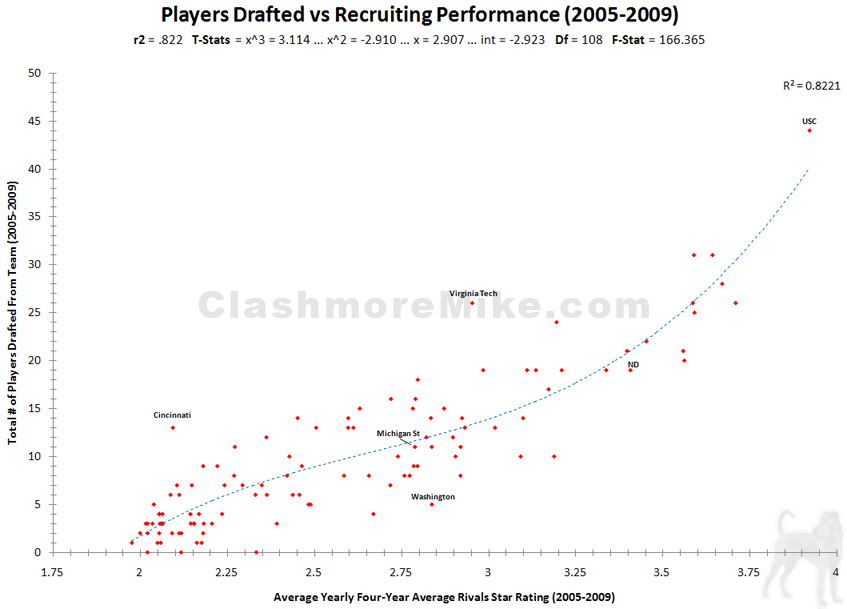
There is an excellent correlation between long-term recruiting performance and the number of NFL draft picks a team produces in a period of time.
A team that produces a lot of NFL draft picks may not necessarily be better than other schools at developing recruits into NFL players, but rather has better incoming talent to work with—less work is needed to turn them into draft picks. Therefore, the more a team exceeds its expected number of draft picks, the better that team is considered at developing its recruited talent—including non-NFL talent. I don’t think it’s a stretch to say that this ability to produce NFL talent can be extended down to the players who aren’t drafted—that there’s better physical strength, speed, and fundamentally-developed players on teams which produce a higher than expected number of NFL players.
This graph shows 2005-2009 recruiting performance versus draft performance. The team with the largest positive deviation away from the expected number of draft picks is Virginia Tech (Cincinnati had the second largest). The development ranking, therefore, ranks programs by how many drafted picks they produced over the expected amount.
It should be noted that because we’re looking at the 2005-2009 time frame as a whole, coaching changes are captured in this metric. So, for example, two of Mark Dantonio’s years at Cincinnati are represented here. But, you’ll see in a second that Kelly deserves most of the credit for Cincy’s developmental performance.
Player Development Ranking from ND’s Perspective
It should not come as a surprise to anyone to find that Notre Dame ranked 89th in player development during 2005-2009. Or maybe it’s surprising that Weis even did that well. Thankfully, ND appears to be bringing in one of the best developers of talent in college football. Kelly has had immediate impacts on the programs that he’s taken over. It shows up in the data, and we’re already seeing some improvements along the training front at Notre Dame in terms of weightlifting numbers after a full summer with coach Longo. But before we launch into the charts, here is some qualitative data to backup the assertion that Kelly is a great developer of talent.
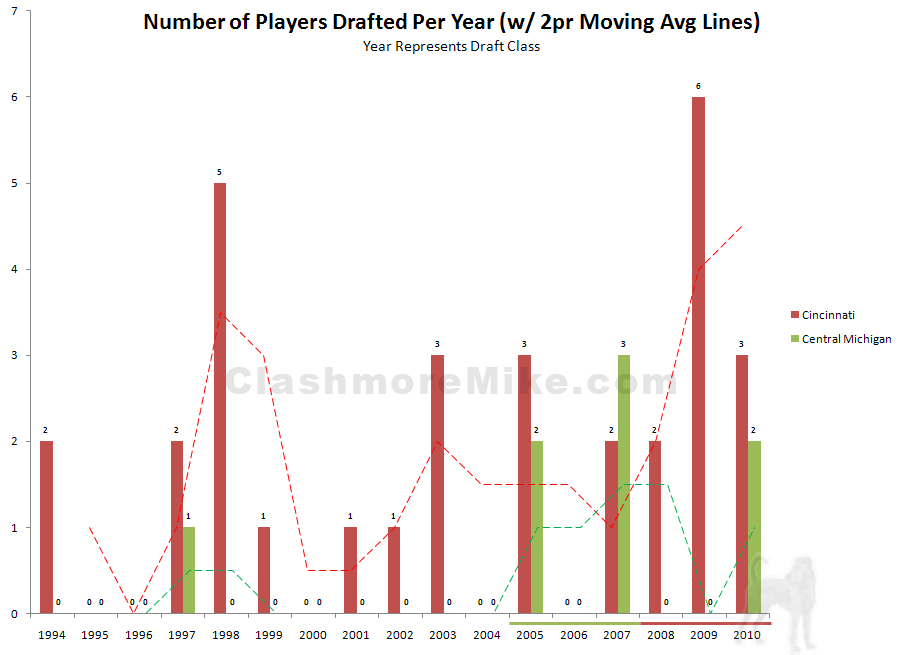
- Central Michigan did not produce a single draft pick from the 1998-2004 draft classes. In Kelly’s first draft class (2005), Central Michigan had two players drafted. Two years later (Kelly’s last draft class there), CMU had another three players drafted, including a first rounder (Joe Staley) and a second rounder. Mike DeBord, the previous head coach, was 12-34 during his time at CMU, so it’s hard to believe he had a huge impact on these players.
- Staley was originally an unknown TE prior to Kelly moving him to OT and developing him into a 1st-round pick.
- Cincinnati’s 2009 draft class was the largest in school history (six players) and included second rounder DE Connor Barwin, a two-star player who was switched from TE to DE prior to his senior season and ended up leading the Big East in sacks.
- Mardy Gilyard, who wasn’t even evaluated by Rivals, was a CB under Dantonio that was switched to WR by Kelly upon arrival and ended up being an AFCA All-American and 4th-round draft pick.
The graph below shows the two period moving average for both teams in terms of number of NFL players taken. The horizontal bars over the years show when Kelly was at those programs.
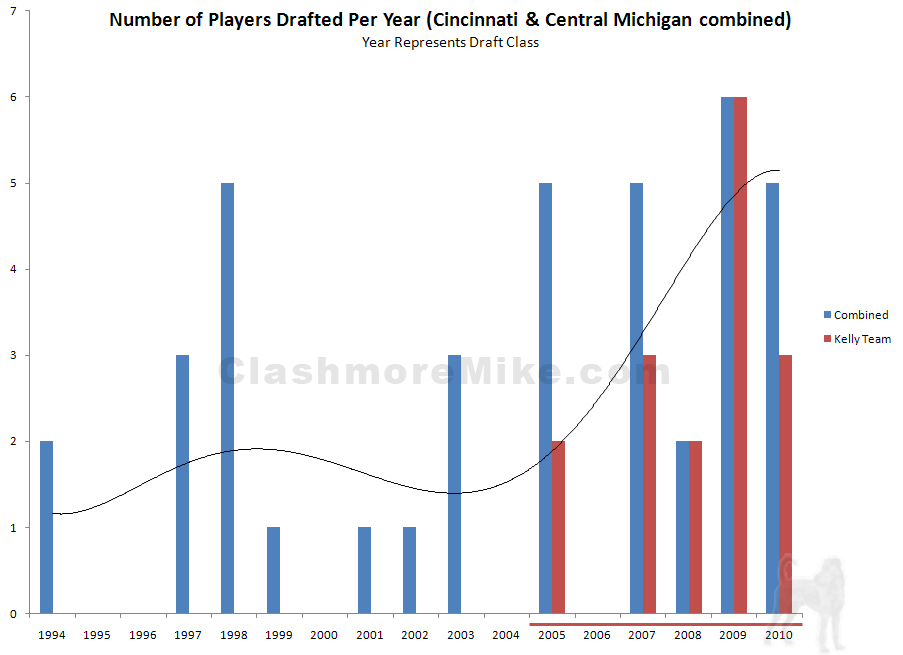
This second graph shows the trend when you combine the number of draft picks from CMU and Cincinnati. The red bars indicates Kelly’s influence, and when combined with the overall trend, shows rather definitively that Kelly’s influence can be largely attributed as a main driver in the increased number of draft picks.
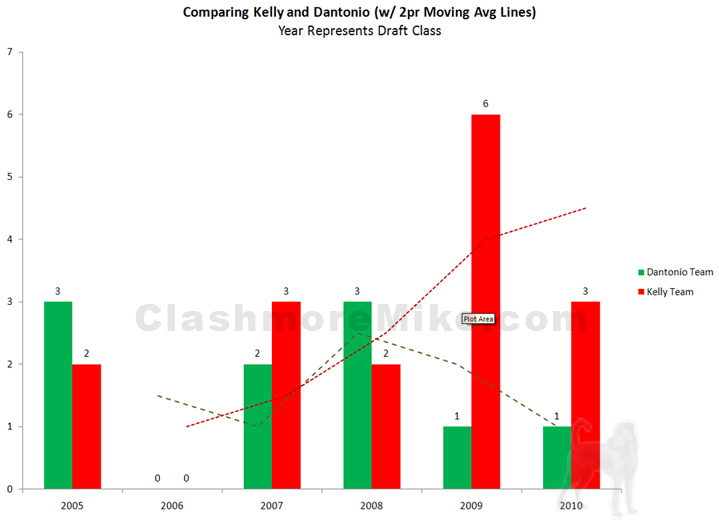
Finally, below is a graph comparing Kelly and Dantonio. Looking at both the data and the graph, I feel that Dantonio has had a negligible difference on his teams in terms of player development. First of all, while Kelly was able to ramp up the player development at both CMU and Cincinnati, Dantonio’s teams have tended to level off or even dip down. Second, given Michigan State’s relative advantage in talent level over Cincinnati (MSU 2.78 average stars for the period, Cincinnati 2.09 average stars), you’d expect a higher number of NFL picks almost regardless of Dantonio’s player development abilities: which is missing.
At the end of the day…
There has been quite a bit of grumbling around Kelly’s recruiting thus far, mainly because that’s the only aspect of the program that the average fan really has any level of insight into at this point. This year’s squad’s four-year average star rating is above the minimum benchmarks noted earlier: 3.61 for a national championship; 3.43 for a national championship appearance. However, there are some scattered clouds on the horizon. A few late additions to the 2010 class dropped the star-rating of that individual class down to 3.44. And even though it’s early, and it’s worth noting that the rankings will likely reshuffle in the coming months, the 2011 class is carrying a 3.39 average star rating as of right now.
Recruiting appears to be on the verge of trending downward, and there aren’t a whole lot of scholarships left in this year’s class to correct it. It’s too early to make any actual judgments, but it’s a situation worth being aware of. The real question isn’t whether or not Notre Dame could set a new minimum benchmark in the future, but rather do we feel comfortable having to be put into the position to have to set a new minimum talent benchmark for winning the national championship? Or even appearing in one?
On the flip-side, it’s not out of the question to think that Kelly could set those new benchmark if he had to. Cincinnati from 2005-2009 ranked 92nd in the recruiting metric we discussed earlier, but was 2nd in player development. Kelly has an eye for moving players into positions that take advantage of their natural strengths and it’s hard to find a better duo in the country than he and Longo when it comes to player development.
We should see that attention to development pay dividends at Notre Dame and it will be interesting to watch players like Theo Riddick, who was switched from RB to WR, along with some of the incoming freshmen that are moving over to the defense. If Notre Dame fans should feel comfortable about one thing, it’s Kelly’s ability to develop and then maximize talent.
Part 2 in this series looks at institutional factors: ease of scheduling and home field impact rankings.


