A Theory on College Football Performance: Part 3 – Game Day Performance
Part 3 of this series of articles will cover the effects that performance in close games and game day management, preparation, and execution have on a program, and how these areas have affected Notre Dame. Part 2 focused on scheduling and the benefit that playing home games while Part 1 focused on recruiting and player development. This article covers the tactical element of the program: what we see on game day.
How It Works
Each team is ranked separately according to six key variables (listed below). For the most part, the lower the ranking the better—the only exception being ease of schedule, where a lower ranking simply implies an easier schedule. For example, a team ranked #1 in recruiting means that, in theory, they were the most talented team throughout the 2005-2009 time period. The rankings correlate with a team’s overall win percentage during the 2005-2009 time period, and they basically state “this is why each team had the winning percentage that they did during this time frame.” I think it will make this concept easier to digest if I only introduce two variables at a time.

The more complicated version: Team Win % = bo + b1R + b2D + b3S + b4H + b5CL + b6G + ε
- R — Recruiting Ranking
- D — Player Development Ranking
- S — Ease of Schedule Ranking
- H — Home Field Impact Ranking
- CL — Clutch or Luck Factor Ranking
- G — Gameday Factors Ranking
The b‘s are parameters to be estimated, and ε is a random error term.
Clutch or Luck Ranking
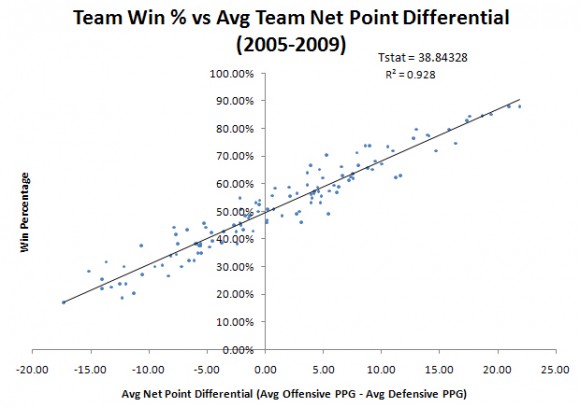
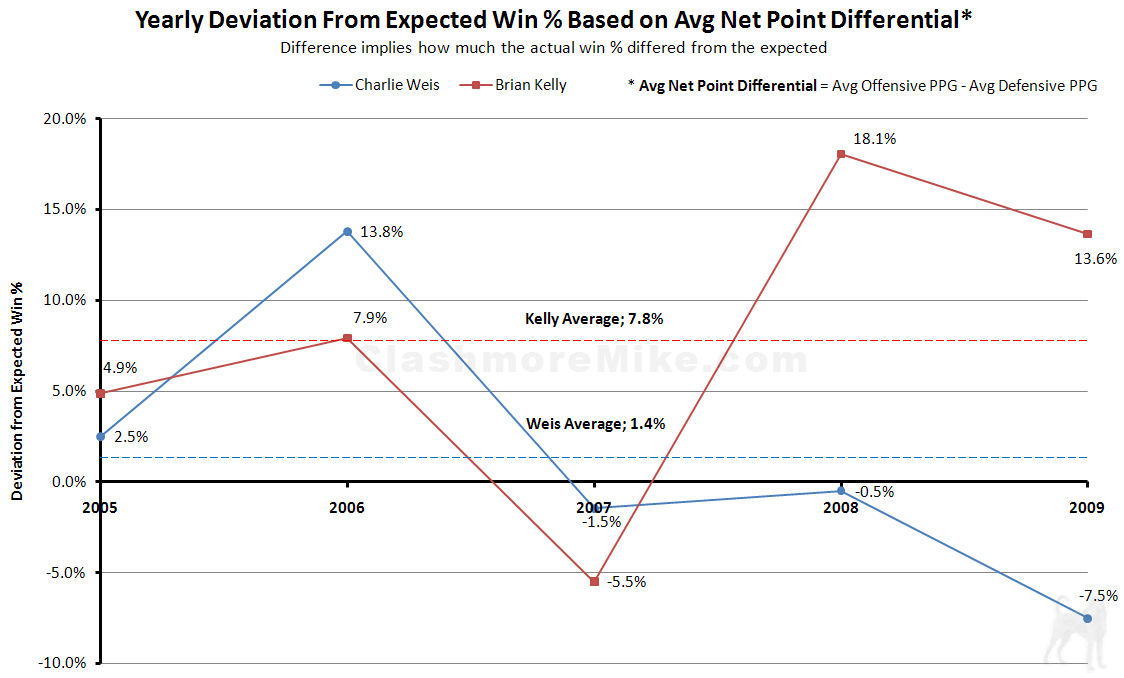
Clutch or Luck Ranking is determined by the difference between a team’s actual performance versus its expected performance based on average net point differential. The lower the ranking, the more “lucky” or “clutch” (depending on which way you lean) a team was during that point in time. This is a topic that we’ve already covered in depth, so I’m going to keep this explanation short. In the short-term, I think that coaches and programs do get lucky. But luck tends to flatten out in the long run, and so significant deviations from the average are more likely the result of something related to the coaching staff’s ability in close games. Therefore, in a five-year study, this ranking should provide pretty good insight into which coaches have an ability to prompt their teams to perform well in close games and which ones don’t. However, some have argued that this type of metric is still more of a measure of luck, which is why we’ve kept “luck” in the title.
Clutch or Luck from ND’s Perspective
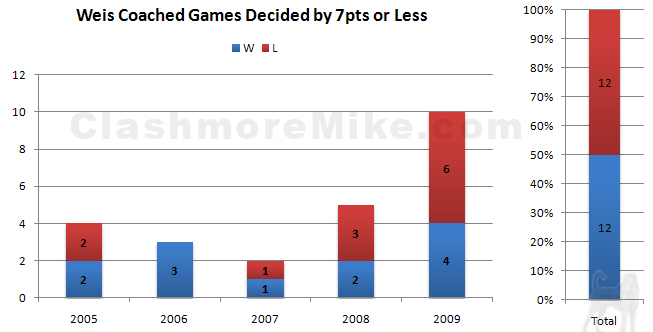
Under the guidance of Charlie Weis, Notre Dame ranked 34th in clutch or luck from 2005-2009. This should strike ND fans as a bit odd after witnessing the 2009 team suffer through six losses from games decided by a touchdown or less—including four in a row to close out the season. But if you look at the yearly deviation from expected chart, Weis performed above or close to the expected overall win percentage up until 2009. He had what appears to be a lucky 2006 campaign, which included “miracle” victories against Michigan State and UCLA, to thank for offsetting his hard luck in 2009.
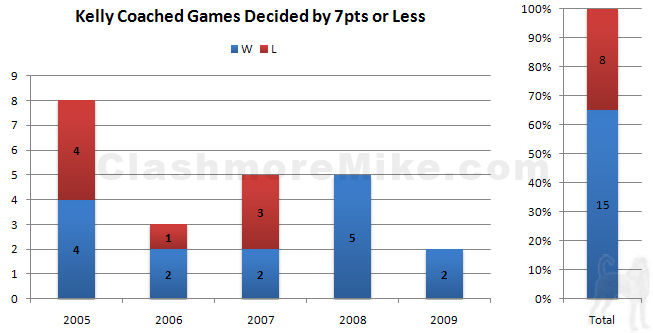
Cincinnati holds the top rank as the most clutch or lucky program from 2005-2009. It’s important to note that Mark Dantonio was the coach for two of those seasons, but Kelly deserves much of the credit for that ranking. Kelly ranks 3rd among all D1 coaches that were active throughout the 2005-2009 time frame in the clutch or luck metric and he was good for an average of one win per season above the expected based on net point differential. Or, to put it another way: Kelly’s presence on the sideline added an additional win per season because of how well his teams performed in close games. Whereas the average D1 coach evens out over the long run—meaning their presence tends not to affect the outcome of a close game one way or the other—Kelly only had a single season where his team’s actual winning percentage was below the expected level based on net point differentia
In fact, Kelly is heading into the 2010 season having won the last seven games which his teams have played that were decided by a touchdown or less. If Charlie Weis could say that, Notre Dame would have been 12-0 after the 2009 regular season and in the national championship game. A bit of light may have been shed on how Kelly prepares his teams for late game situations during his August 26th press conference when discussing having the team practice 49 different in-game scenarios he’s come across during his coaching career:
“Tomorrow we will have our bench control script which is about 49 different scenarios that will occur during the game. I was telling the team that when I first started back at Grand Valley, I had about 16 scenarios, between 16 and 18, and we have worked our way up to 49. So I don’t know if that says a lot about my experience dealing with different things in the game or the obsessiveness of the coach trying to cover every scenario that may never occur, but you want to be covered anyway….
…Obviously, I have learned some of them by being involved and one of them was against West Virginia a couple of years ago. We had a 19-point lead with about a minute and three seconds left on the clock. Every scenario, we had to make certain played out, and it did. And that was to decide do you take the safety or punt the ball. So we put in what we call turtle punt now which kills approximately six to eight seconds and you can hold. We had the whole team just hold because we don’t care if we get a penalty in that situation. But we have to get eight seconds off the clock. So imagine that scenario was a learning experience because if we had taken off a few more seconds in the West Virginia game, they wouldn’t have had a chance to tie it up and send it into overtime. So turtle punt is an experience just two years ago—I think it’s number 47 now on the list.” —Brian Kelly, August 26, 2010 Press Conference
This also serves to illuminate the value of having a man at the helm with as much head coaching experience as Kelly has to fall back upon. While critics jump on the fact that Kelly spent such a large portion of his career at Grand Valley State, he still undoubtedly gained situational head coaching skills that can only come from tangible experience. Does it really matter which level of football you pull those on-field experiences from? I say, for the most part, no. That’s why you don’t hire head coaches to learn on the job at a place like Notre Dame.
Game Day Factors Ranking
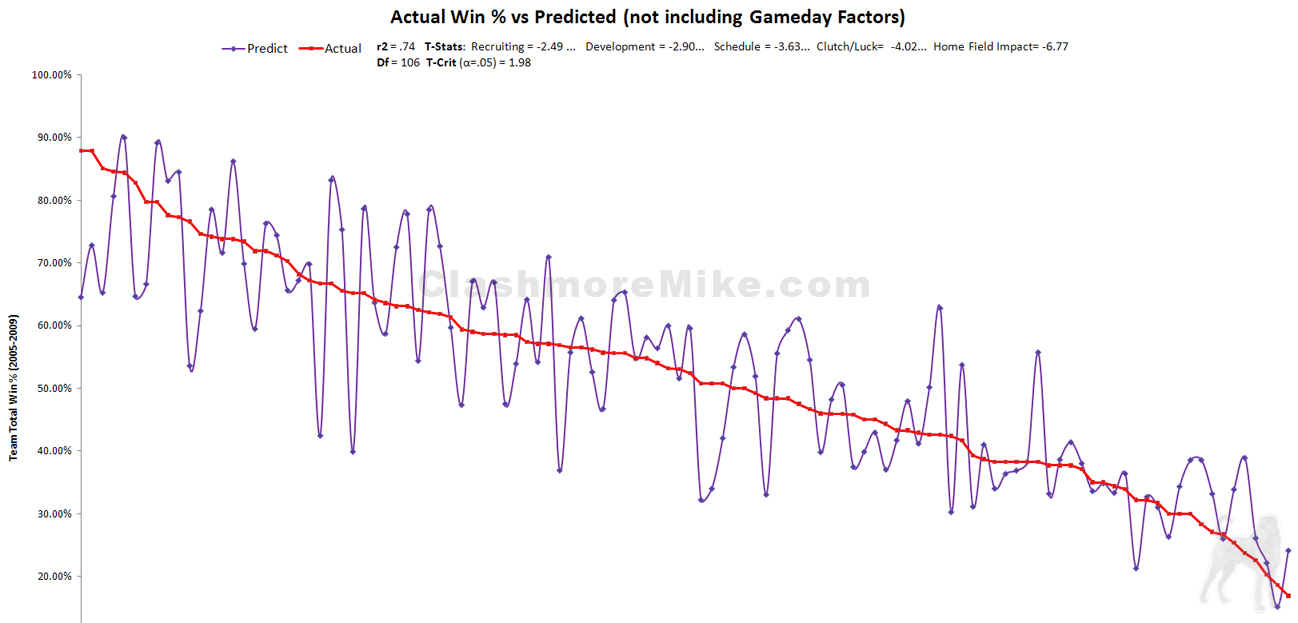
We’ve come to the 6th and final variable in the model—and the most theoretical one. It’s important to remind the reader that models are simply abstractions of reality and are merely intended to simplify the world around us. There will never be a way to truly measure how well coaches prepare their teams for game day, manage a game, and get their teams to execute. But we can certainly try and estimate it. If you scroll up to the original theory equation, we have a way to estimate every variable so far except Game Day Factors (G). The graph on the left shows that we can explain about 3/4ths of the variation in win percentage with the five variables that we already have, and we already know what each team’s actual win percentage is. We should be able to algebraically manipulate our equation to answer what “G” is:
- Win % = R + D + S + H + CL + G
- G = Win % – R – D – S – H – CL
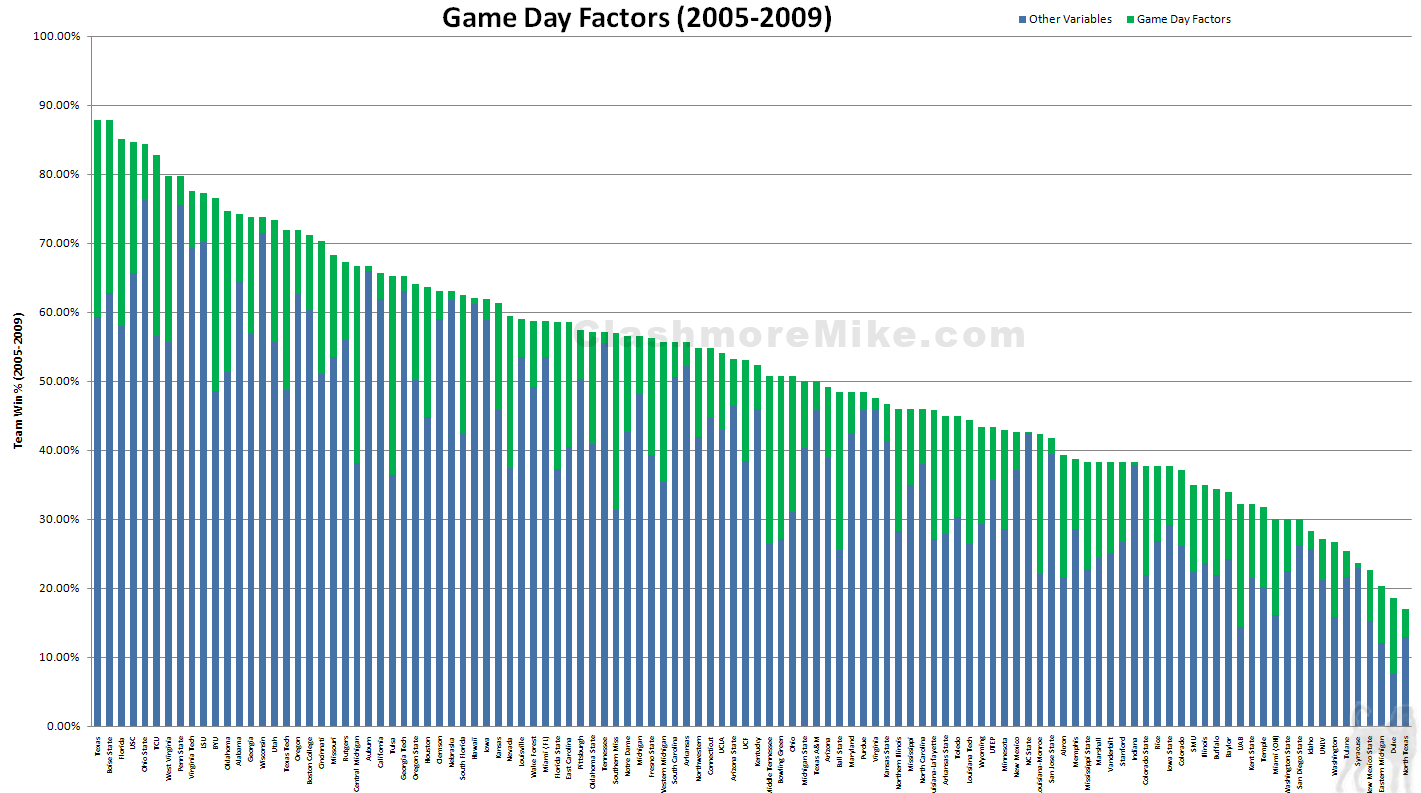
In other words, if you look at the graph, we’re saying is that the difference between the predicted win percentage based on the first five variables and the actual win % is due to factors related to the remaining variable, “G”—the Game Day factors. We can say this logically, because we’ve already theoretically accounted for just about everything else: talent, player development, schedule, home field impact, and luck (or performance in close games). So what’s left is the tactical stuff related to game day (execution, scheme, management, etc.). Therefore, the ranking comes from the difference between the team’s actual win percentage and the predicted based on the other variables. The lower the ranking, the better a team is on game day. Granted, this is essentially a catch-all statistic, and so other smaller issues that could affect a team’s performance will get caught in this statistic as well: things like injuries, transfers, weather, and other “random”occurrences. But we have no easy way of separating that kind of thing out beyond this type of metric.
Why don’t we use on-the-field statistics to rank a team’s performance? Because stats like offensive yards per game could easily be affected by the variables we’ve already looked at, so it’s hard to say how to filter them out—it might be impossible. So we don’t use any statistics at all when looking at on the field performance.
Game Day Factors will be looked at in greater detail in the last article in this series.
Game Day Factors from ND’s Perspective
Notre Dame ranked 49th in this metric during the Weis years. Which makes sense: the Irish fielded a very good to excellent offense three out of five years, but any offensive accomplishments were generally offset by a below average to terrible defense year-in-year-out. Despite his bluster about a schematic advantage, Notre Dame was essentially an schematically average team on game day under Weis. No matter how hard he tried, Weis couldn’t figure out how to run the team as a whole, and it showed up on game day when the offense was constantly forced to carry the entire load. The results were often disastrous when it couldn’t.
Notre Dame Scoring Offense and Defense Rankings
[table id=304 /]
Cincinnati ranked 28th in Game Day Factors from 2005-2009, but that relatively high ranking might actually understate Kelly’s effect on the team, thanks to two moderate years under Dantonio that get caught in this metric. When Kelly arrived in 2007, he was able to maintain Dantonio’s defense while instantly injecting life into the offense. The scoring offense jumped from 82nd in 2006 in Dantonio’s last year to 16th in 2007. Even in a down defensive year (2009) when Cincinnati needed to replace the majority of the starters and break in a new defensive coordinator, the defense remained somewhat respectable with a 44th ranked scoring unit. It’s also worth noting that Kelly went through five different quarterbacks due to injuries in 2008, which goes a long way towards explaining the drop-off in offensive scoring that year. Kelly’s extensive experience as a head coach trumps the NFL coordinator yet again. And with far less recruited talent and a relatively comparable schedule.
Cincinnati Scoring Offense and Defense Rankings
[table id=305 /]
At the end of the day…
 The common thread in all of this is that Kelly clearly has at least one distinct advantage over Weis coming into the Notre Dame job: head coaching experience. Kelly has an extensive list of in-game scenarios that he’s come across throughout his head coaching career and he prepares his team for them. He clearly knows how to close out games, something that Weis mightily struggled with in 2009. Further, it was quite apparent throughout his Notre Dame career that Weis was still just an offensive coordinator at heart. He never learned how to manage the team as a whole. So while his offenses could put up numbers, Weis could never figure out how to lead the defense to similar feats. Despite his reputation as an offensive-minded guy, Kelly’s defenses at Cincinnati were never below average. He’s been quite involved in the defensive aspects of the game, while Weis preferred to hire a defensive coordinator that exclusively handled everything associated with that part of the team.
It’s important to remember that Kelly was working with a Cincinnati team that did not come close to fielding the same talent as Notre Dame. It’s also important to note that Cincinnati played very comparable schedules to Notre Dame, especially in 2008 and 2009. Yet Kelly was able to do a lot more with far less. Here’s why:
- Kelly has a system and he sticks to it rain or shine—Notre Dame seemed to have a new identity on both sides of the ball every season under Weis; sometimes even on a game-to-game basis.
- Kelly’s offense is relatively simple and easy to execute, whereas the pro-style offense Weis ran took time to learn. Part of the reason why 2007 occurred is because Weis tried to force-feed his playbook on a bunch of underclassmen that were still trying to learn how to play football, let alone learn a huge playbook.
- Kelly designs his practices to be extremely fast-paced in order to maximize the limited time the coaching staff has with the players each week. Weis preferred “pro-style” practices that were slow-paced walkthroughs—it may have preserved the health of players, but it wasted valuable teaching time.
Even though the Game Day Factors ranking is theoretical in nature, I do believe that it captures these differences well. If you look at the other five variables as inputs, Cincinnati simply should not have had the output that it did (wins). The main difference is really what the coaches do with their time and how they get their teams to perform on game day, given all of the other variables. Looking at it this way, Weis was simply average: he may be a great pro offensive coordinator, but he was not an elite college head coach. It seemed like he just didn’t understand the college game well enough. Kelly has been brought up in college football. He understands that it’s less about complicated schemes and more about fundamentals and execution. We should see that difference pay off, and if history is any indicator, very soon.
The last article in this series will tackle 5-year team profiles and their applications.


